

We check all the maps, so you don't have to

The pest and building inspection you need for the land.

You would not buy a house without one. MapCheck checks 140+ NSW Government datasets against a single property and tells you what the land allows, what restricts it, and what it could earn.

GNAF · Multi-lot
9 in 10
rural-zoned lots carry some regulated veg
140+
NSW Government datasets
On-demand
turnaround
$499
reports from
Live cadastre · NSW Planning DB
Search any NSW address or Lot/DP to see the property outlined on the map.
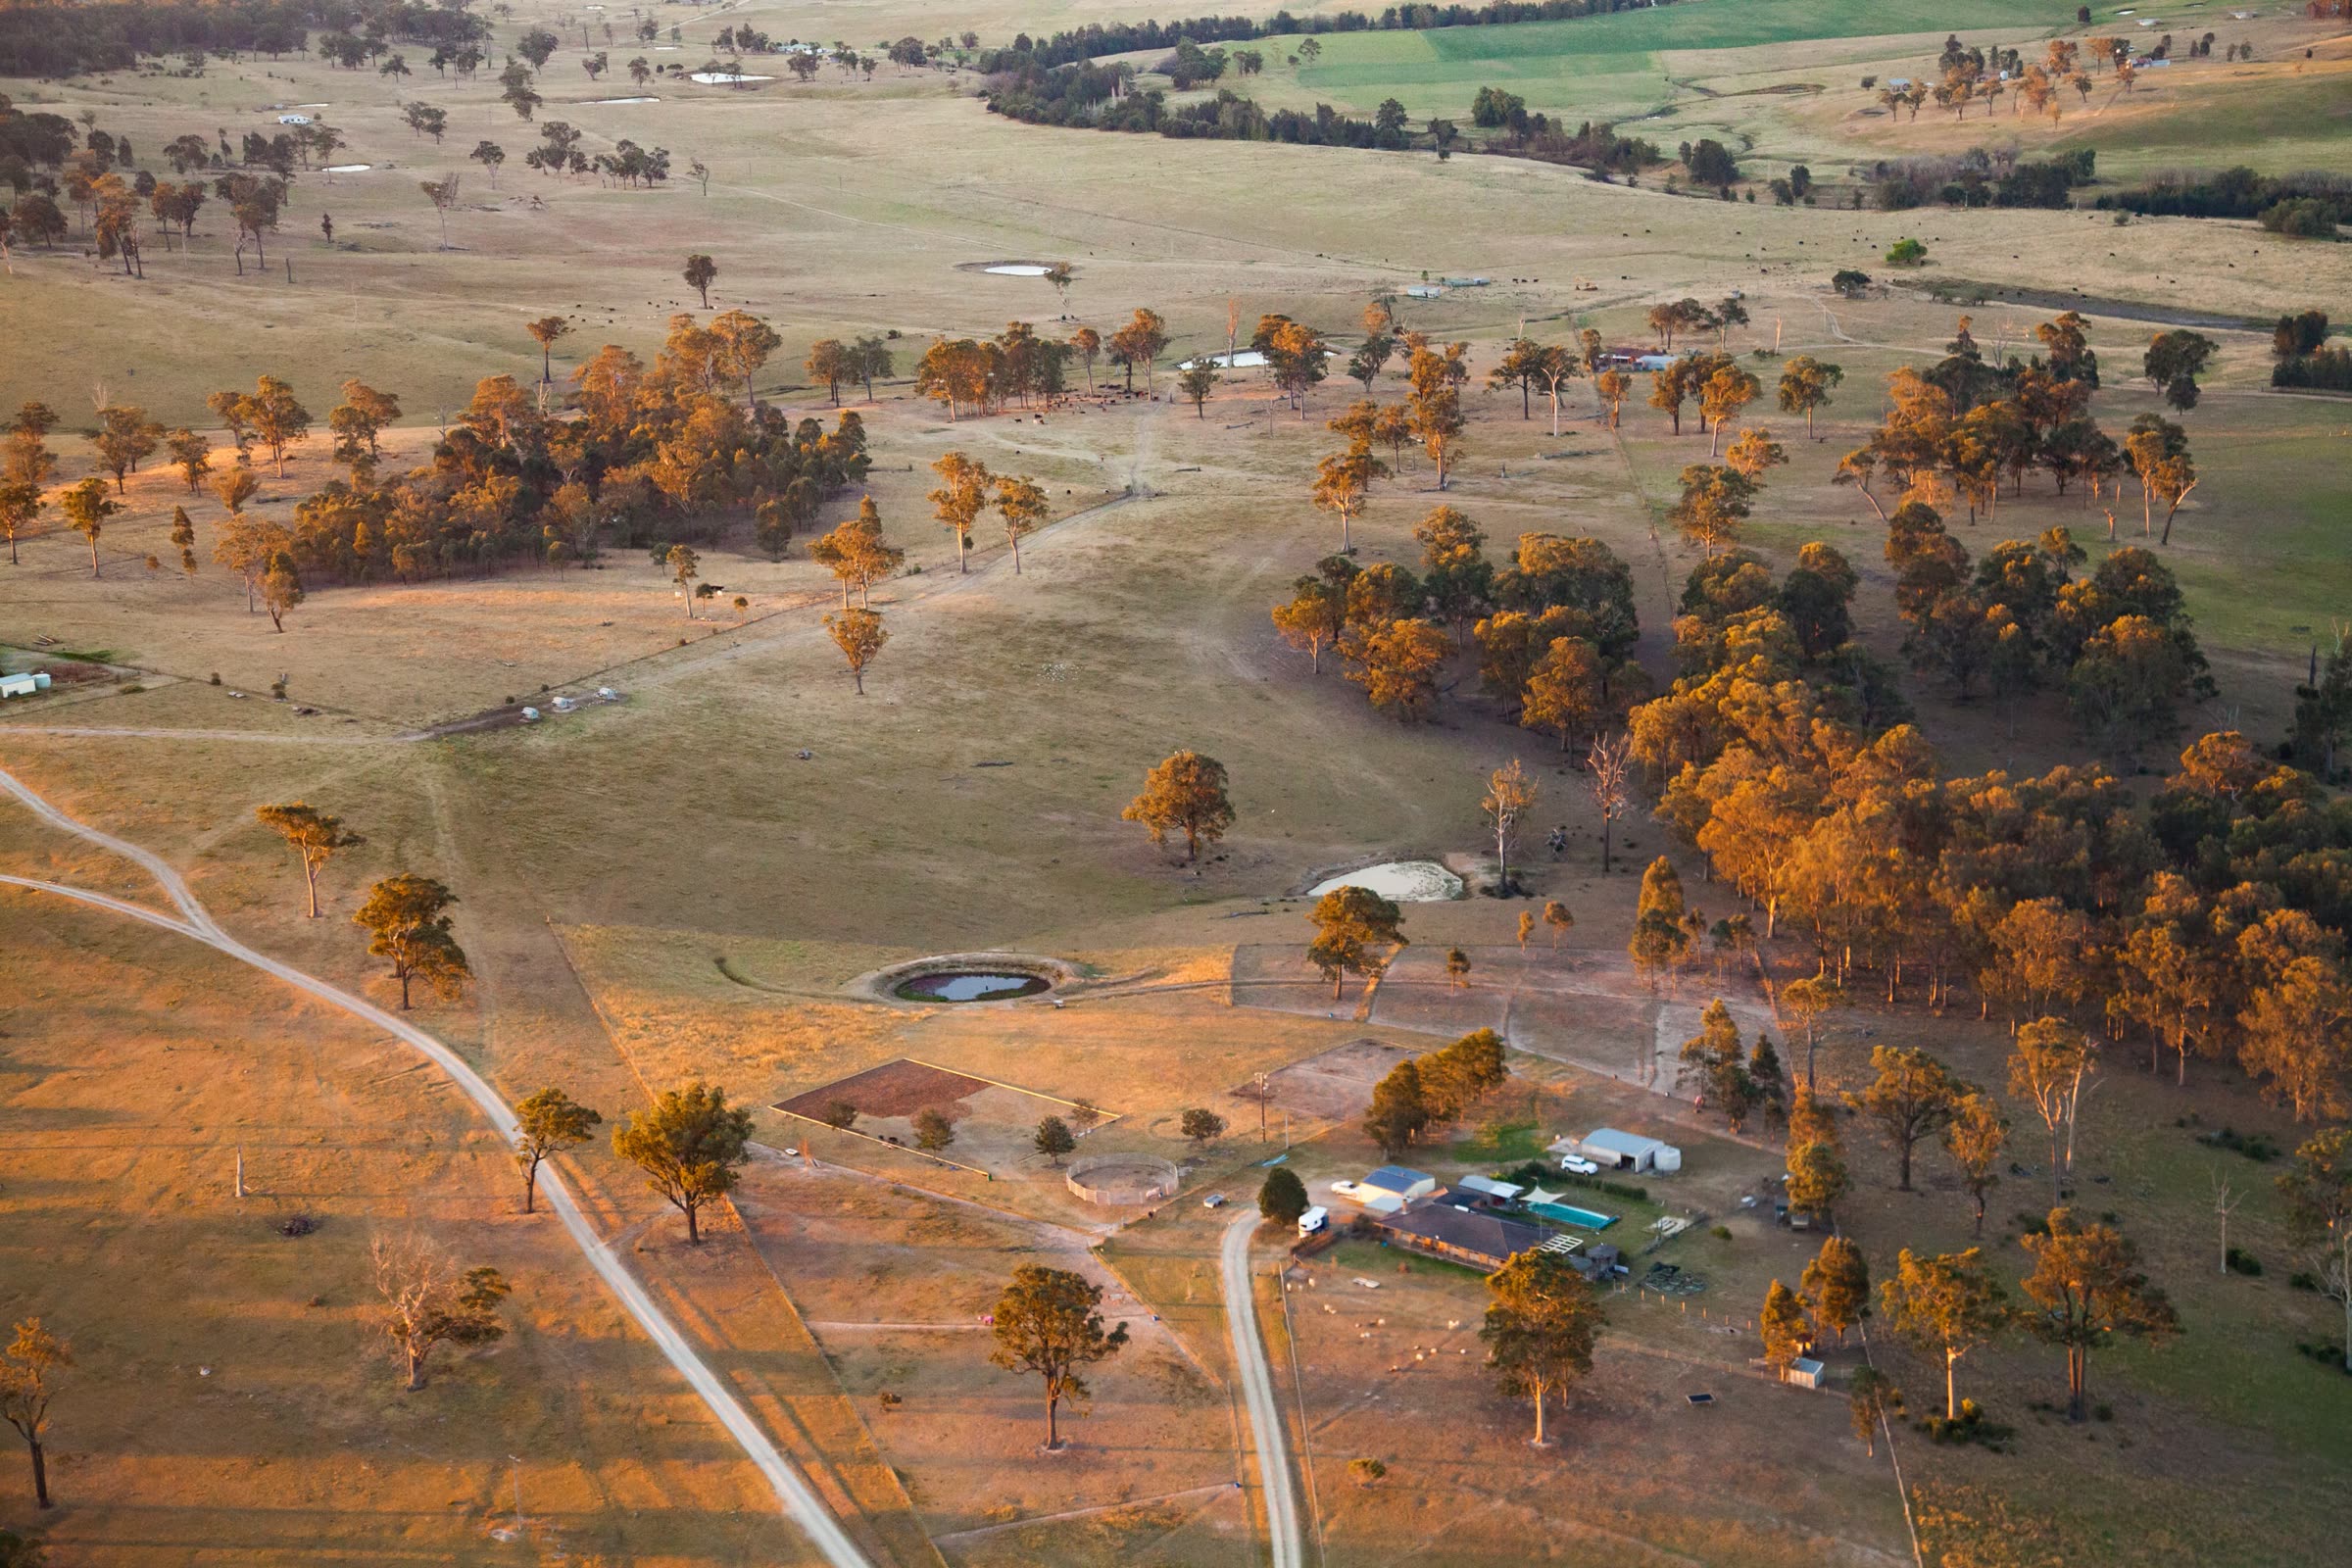
Aerial view of grazing country near Elderslie, New South Wales, with a homestead, dam and tracks among scattered trees

Rural NSW

Every property has a story the contract doesn't tell.

Why it matters

What the land allows, and what it could earn.

Two things a contract of sale will not tell you.

88%

carry at least some regulated native vegetation

Across the 630,637 lots in rural zones regulated under the Local Land Services Act, 88 per cent carry at least some Category 2 regulated native vegetation, and 67 per cent carry it across at least a tenth of the parcel. Close to 9 in 10 on any reading, and two in three on a strict one.

MapCheck analysis of the NSW Native Vegetation Regulatory Map (Transitional), March 2026.

$8.77M

in ecosystem credits on one 373 ha holding

That same holding has a land value of $3.28M and sits entirely under vegetation regulation. Constraint and opportunity are the same mapping, read two ways.

From a MapCheck report on a de-identified holding in Snowy Monaro Regional; land value at 1 July 2025. One property, not a market average.

What gets checked

140+ datasets. Here is what they are about.

Plain English throughout - no raw data, and no government maps you cannot read.

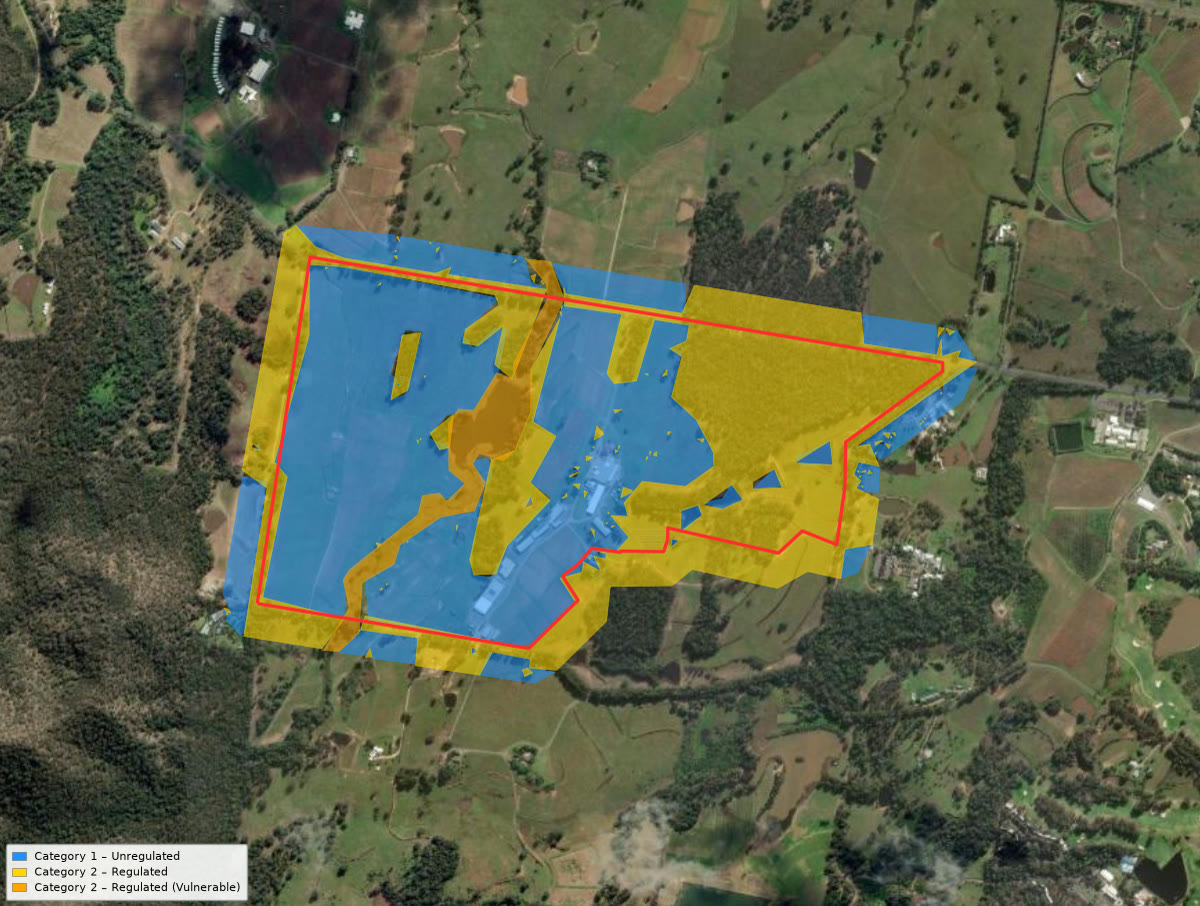
Native vegetation NVR categories, clearable area

Category 1 and Category 2 areas mapped over your boundary, and the constraint waterfall that takes the lot from its total area down to what is actually clearable - reported as the maximally farmable area in hectares and as a percentage.

Plant communities PCT inventory, TEC and EEC flags

Every Plant Community Type on the lot with its area, and whether it is listed as a Threatened or Endangered Ecological Community under the BC Act or the EPBC Act.

Threatened species Sightings within 500 m, koala habitat

Recorded threatened species sightings within a 500 metre buffer of the boundary, and Koala Management Area classification where it applies.

Water Watercourses, stream order, dam siting

The watercourse network over your boundary ranked by Strahler stream order, the dams already there, and a dam siting analysis with estimated capacity. Groundwater productivity and river condition index come with the ADVANCED report.

Bushfire and flood RFS categories, flood mapping

RFS bushfire-prone land categories across the lot with fire history detail, alongside mapped flood risk.

Land value and tax Valuer General, comparable sales

The Valuer General land value with a land tax estimate, comparable sales, and financial scenarios built on them.

Native title and Crown land Claims, adjacent parcels

Native title claims, determinations and Indigenous Land Use Agreements affecting the lot, plus Crown Land parcels adjacent to or overlapping the boundary and the adjacent risk register that goes with them.

Stewardship BSA viability, credit types

A Biodiversity Stewardship viability score for the lot, the ecosystem credit types it could generate, and what those credits could be worth.

Water

Which of these actually run?

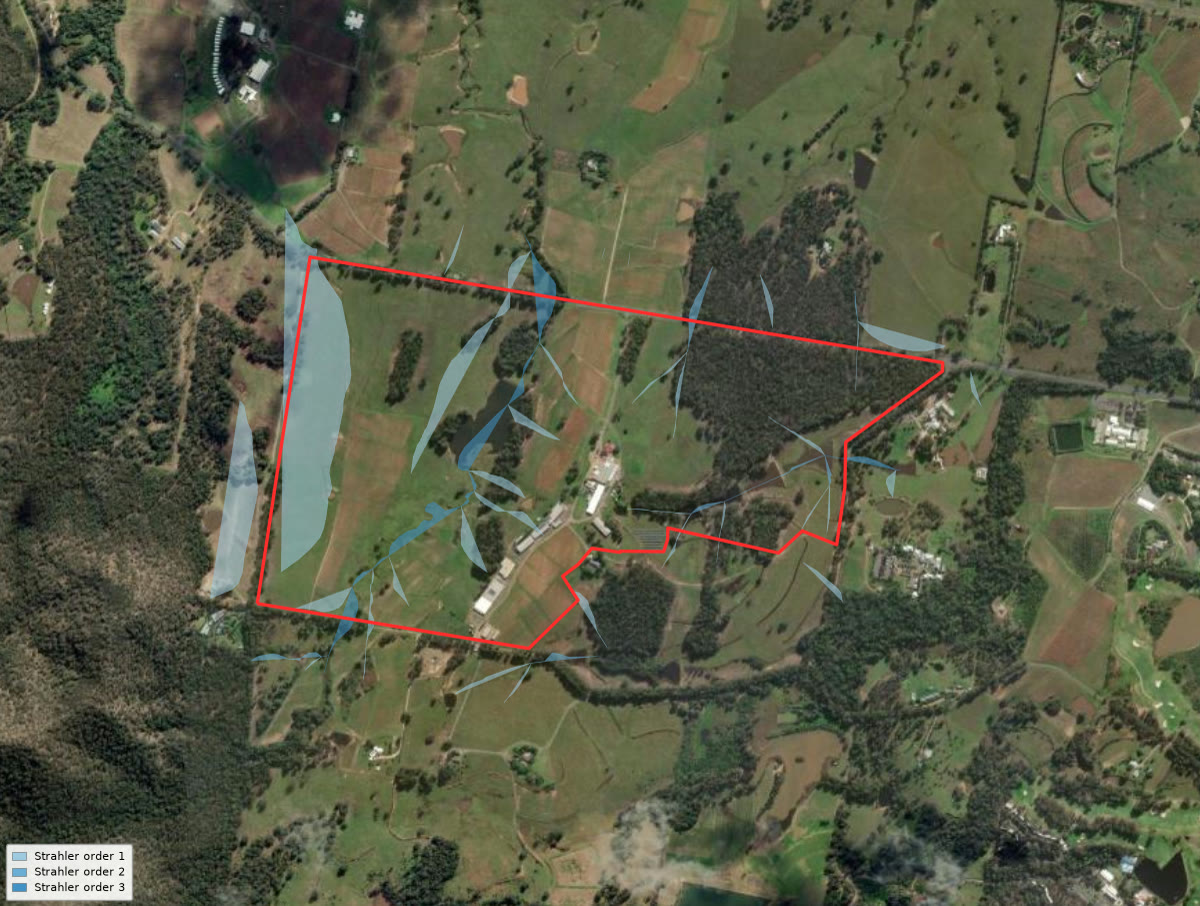
Every rural block has lines on a map that look like watercourses. Stream order ranks them one through six by how much country drains into them. Your report maps them over your boundary, alongside the dams already there.

Stream order overlay mapped across a de-identified rural boundary
Live renderThe proof. Stream order over a de-identified sample block, the Hunter Valley.
Gum trees lit by last light beside a farm dam near Mudgee, New South Wales

How it works

Simple. Fast. No fuss.

Search, then see what's flagged

Address or lot on plan. The preview is free and needs no account. Every flag is drawn over your actual boundary, not described in a paragraph.

  1. Give us the address, or the lot on plan Use the search at the top of this page, or email us the lot and deposited plan number. An address on its own is fine. Takes two minutes
  2. We build the report 140+ NSW Government datasets, assembled into a structured, plain English report. Every layer is validated against its source before it goes out. On demand
  3. It lands in your inbox A PDF you can take to a negotiation, a planner or a lender. The Education Package adds a walkthrough of the findings. Straight to your inbox
Native vegetation categories shaded across a de-identified rural boundary
Live renderNative vegetation categories over the boundary.

The same data, three questions

What people actually come here to find out

Man standing on a rural property near Carrowbrook, New South Wales

“Should I buy this?”

Rural property buyers. A first-pass read before the building inspection and before the solicitor's bill starts running.

Check a property →
Grazier in a broad hat on his property near Armidale, New South Wales

“What have I got?”

Rural landholders. What can be cleared, what the capability class supports, and what the vegetation might be worth left standing.

For landholders →
Farmer standing in a paddock in the Hilltops region of New South Wales

“What do I tell the buyer?”

Real estate agents. Credible environmental context on a listing, before a buyer's adviser finds it first.

For agents →
REPORT PACKAGES

Side by side feature comparison

Land Constraint & Capability Assessment

$499 per report

Run it before you make an offer. Tells you how much of the land is freely manageable and how much sits behind Native Vegetation Regulation. 10-page rural diligence report.

  • Constraint waterfall — NVR Cat 2 / 3 / 4 deductions
  • Maximally farmable area (hectares + %)
  • DSE grazing capacity by land class
  • LGA regional benchmark comparison
  • Plant Community Type inventory + TEC/EEC flags
  • Threatened species sightings (500m buffer)
  • Watercourse network + Strahler order
  • Biodiversity corridors crossing your boundary
  • Subdivision potential at minimum lot size
  • Grid + road infrastructure summary
ORDER LCCA REPORT — AU$499

Education Package

$2,499 per report

The full PEA report plus a 1-hour guided walkthrough with our team. We're highly experienced in NSW biodiversity data and property mapping — pick this when you'd rather not read your report alone.

  • Everything in the Property & Environmental Assessment
  • 60-min video walkthrough with our team
  • We read your report before the call
  • Q&A on your specific situation and decision deadlines
  • Things worth thinking about for next-step assessments
  • Follow-up notes emailed after the call
  • Optional add-on: Property Exclusivity Quote
ORDER EDUCATION PACKAGE — AU$2,499

Plain answers to
straight questions.

If something’s not covered here, just email us. We respond fast.

More than one property?

Bulk pricing for developers, law firms, councils and environmental consultants. White-label options available.

Ask about bulk pricing →
Sunset sky over grassy farmland with a fence line near Wean, New South Wales

Don't go in blind. Get a MapCheck.

Free to check. Reports from A$499.