What environmental checks matter for NSW rural buyers
Before you sign anything, do you know what you're actually buying? NSW rural properties carry layers of regulation that standard searches don't...
6 min read
Ask anyone who has taken an extractive industry proposal through the NSW planning system and they will tell you the same thing: the rock is usually the easy part. Proposals stall on everything around the rock. Native vegetation that triggers offset obligations. A threatened species record 400m from the pit shell. An Aboriginal heritage survey gap. A council road that was never going to carry a laden truck and dog. A classified road access point that brings Transport for NSW into the room.
Each of those is knowable before anyone commissions a consultant, walks the site or opens negotiations with a landholder. Most of them sit in public government datasets. The problem has never been secrecy. It is that the answers live in a dozen portals, and assembling them for one candidate site is a slow manual job, so it gets done for the preferred site only, late, after money and attachment have accumulated.
Pre-screening inverts that. Run the full constraint stack across every candidate at the start, and let the sites compete.
Quarry site pre-screening in NSW means testing every candidate site against four groups of government data before any consultant is engaged:
Sites that fail on any one of the four drop out before they cost anything. The sites that survive arrive with their consultant scope already drafted.
Zoning maps say what is permissible. Geology maps say what is winnable. Neither says what is approvable, and approvable is the only question that pays.
MapCheck holds pre-computed constraint data for every one of the 3.34 million cadastral lots in NSW, screening 140+ NSW Government datasets across all 128 local government areas. For extractive industry, that screen groups into four layers.
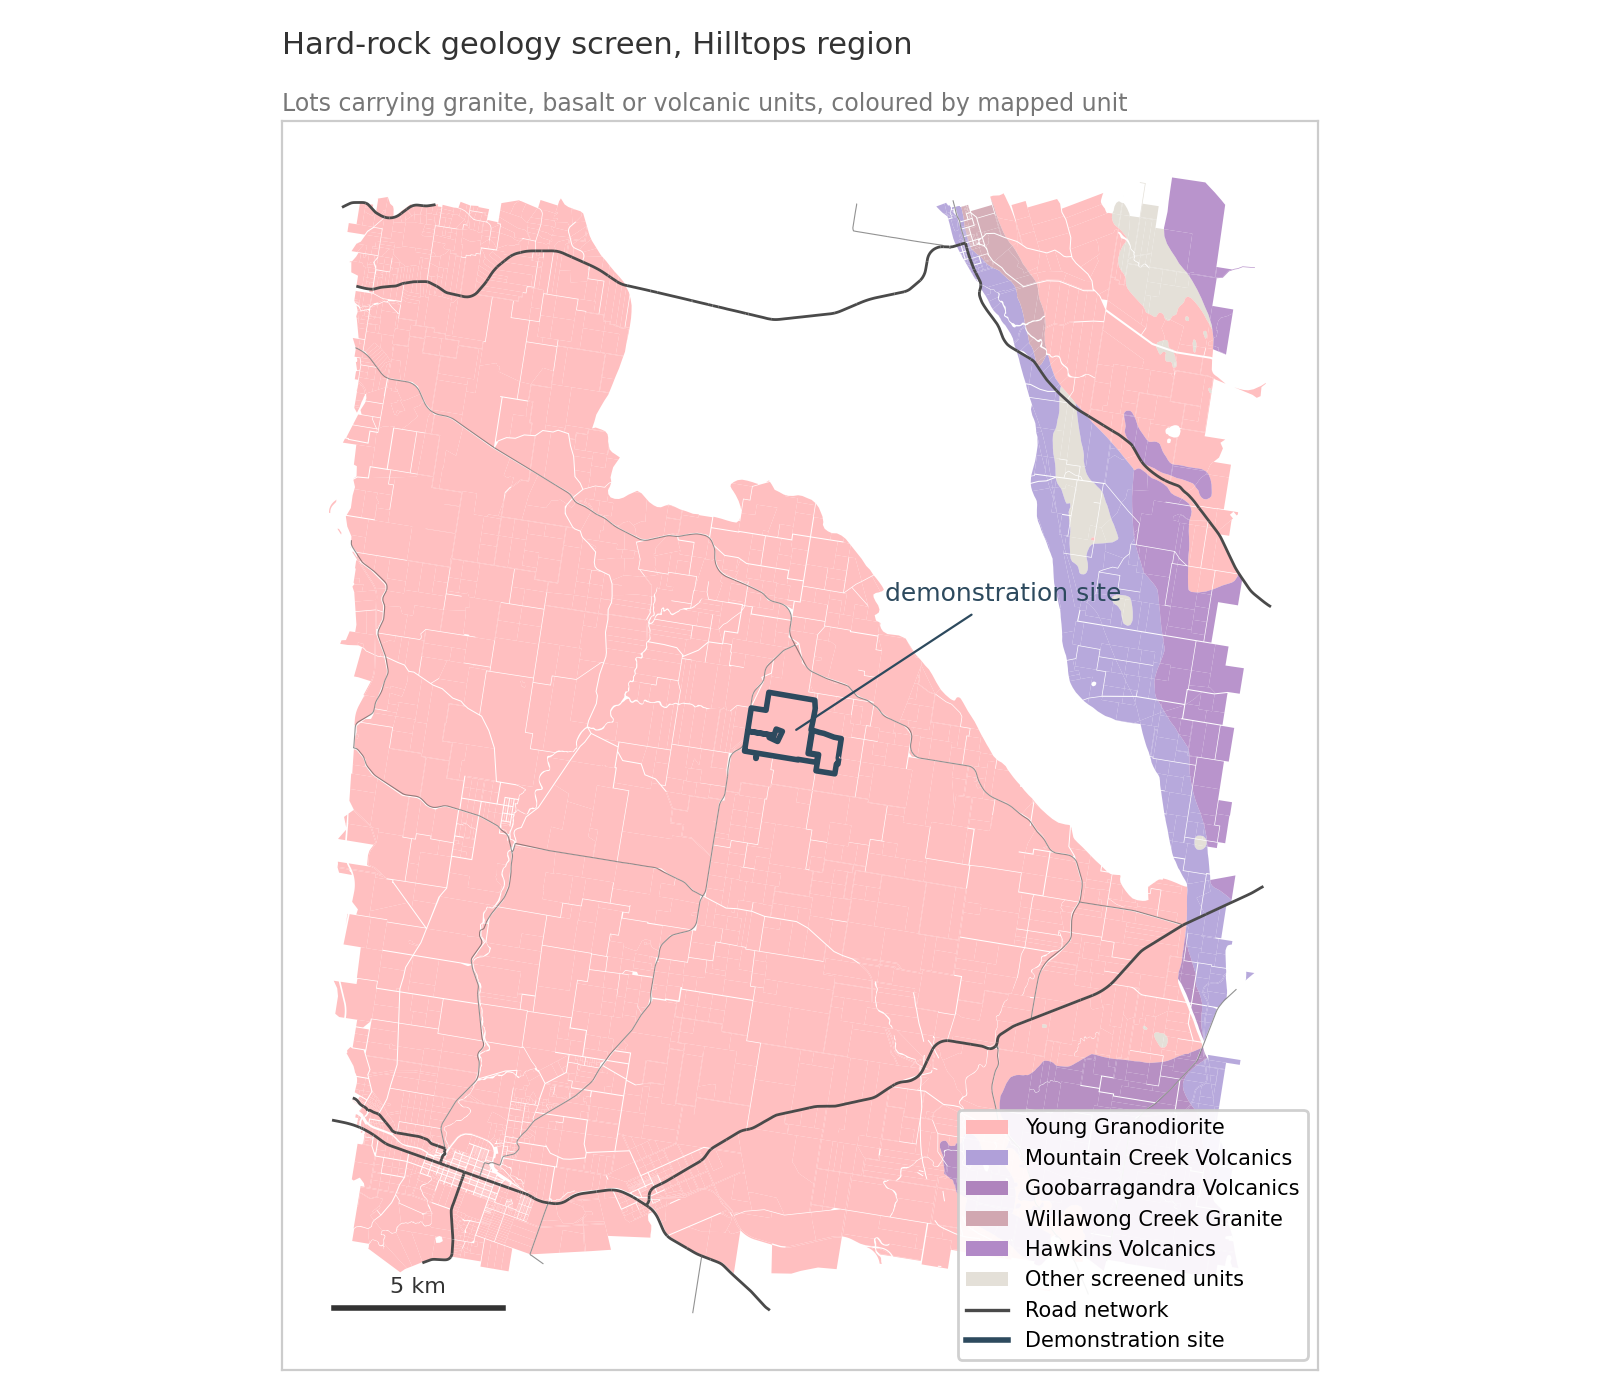
Mapped surface geology per lot, including the hard-rock types that matter (basalt, granite, granodiorite and their neighbours), mineral resource land under the relevant environmental planning instruments, existing mining and exploration titles, and mineral occurrence records.
This is a desktop indication from state mapping, not a drilling program. It is enough to sort a long list into worth-a-geologist and not-worth-a-geologist.
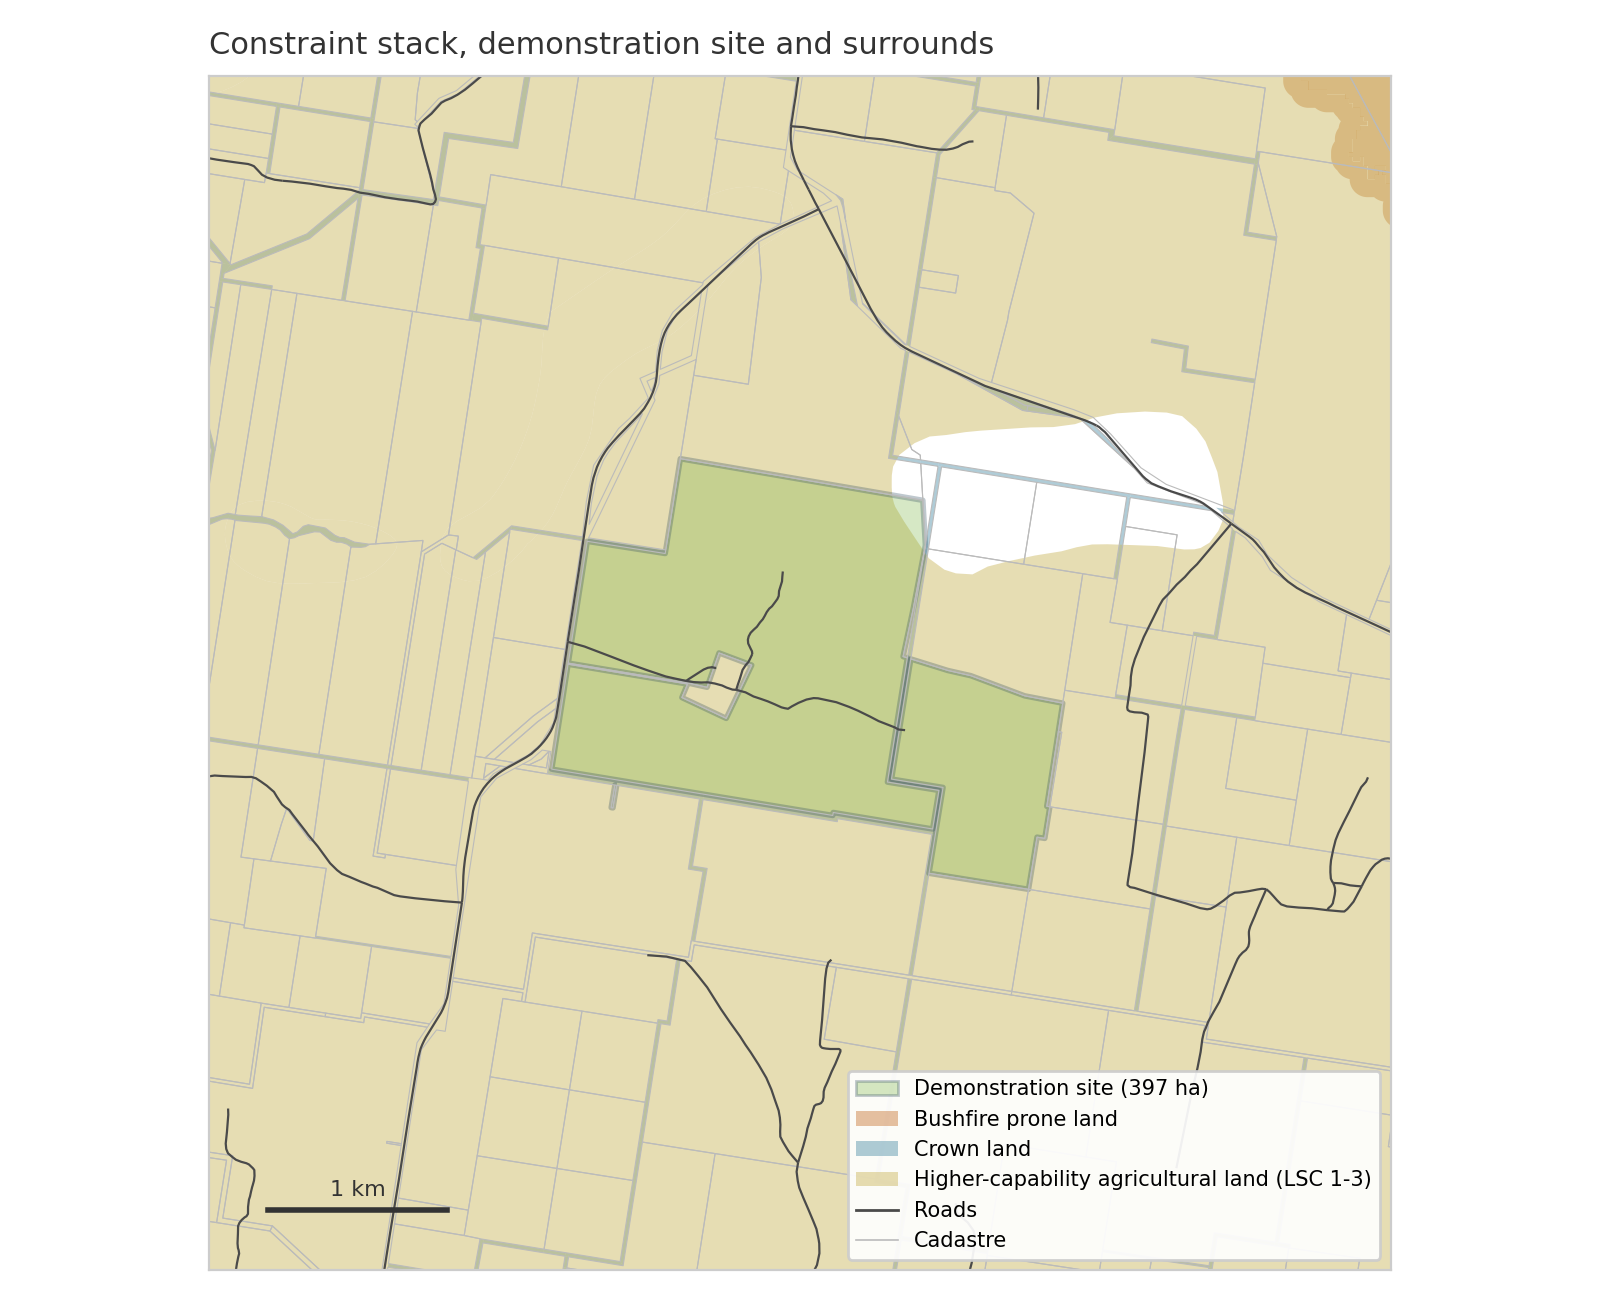
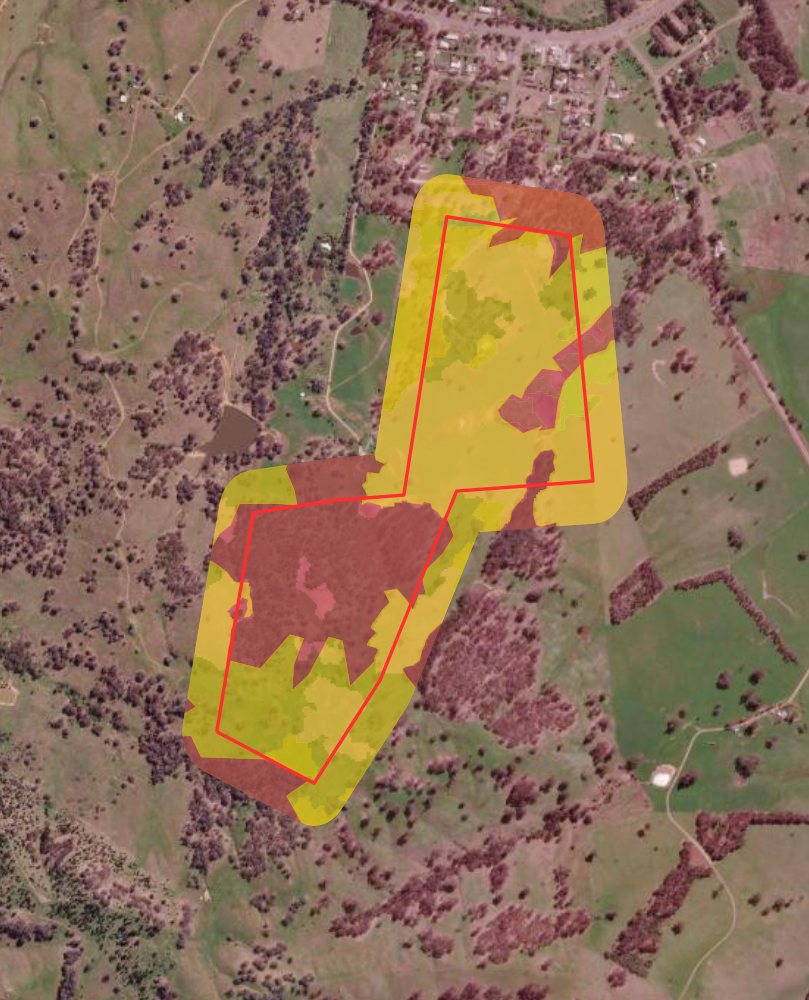
Native vegetation regulatory categories, plant community types (PCT) and their threatened ecological community (EEC) status, threatened species records at several distances from the lot, koala habitat mapping, biodiversity values mapping, watercourses and their buffers, water sharing plan areas, groundwater vulnerability, and bushfire prone land.
In NSW these datasets do more than describe the site. They drive which approval pathway the proposal enters, whether biodiversity offset obligations arise, and what a site's offset bill might look like against current credit market data. The clearing categories themselves come from the NSW Native Vegetation Regulatory Map, and the terms above are set out in our plain-English glossary of NSW rural land terms.
Recorded Aboriginal heritage surveys and site prediction modelling, gazetted Aboriginal places, state and local heritage items, dwelling proximity and the receptor pattern around the site, and the planning buffers other land uses cast over it.
A technically perfect quarry 800m upwind of a village is not a quarry.
This is the layer almost everyone underestimates, and the one where we have just extended the stack.
A quarry lives or dies on truck movements. Every tonne leaves by road, and the questions that decide whether that works are specific: what class of heavy vehicle can lawfully use the route, how steep is it, where can a laden combination regain road speed, and what does the sight distance look like at the access?
Standard spatial data answers almost none of that. Road centreline datasets record whether a road is one lane or two, sealed or unsealed, and that is roughly where they stop. Overtaking lanes, climbing lanes and merge points are invisible in the data. Gradients are absent entirely, because the source mapping is flat.
So we built the missing layer. MapCheck now computes an elevation and gradient profile for the NSW road network, derived from satellite elevation data draped over every road segment in the state, joined to the heavy vehicle access classifications we already hold. For a candidate quarry site, that turns the access question into numbers:
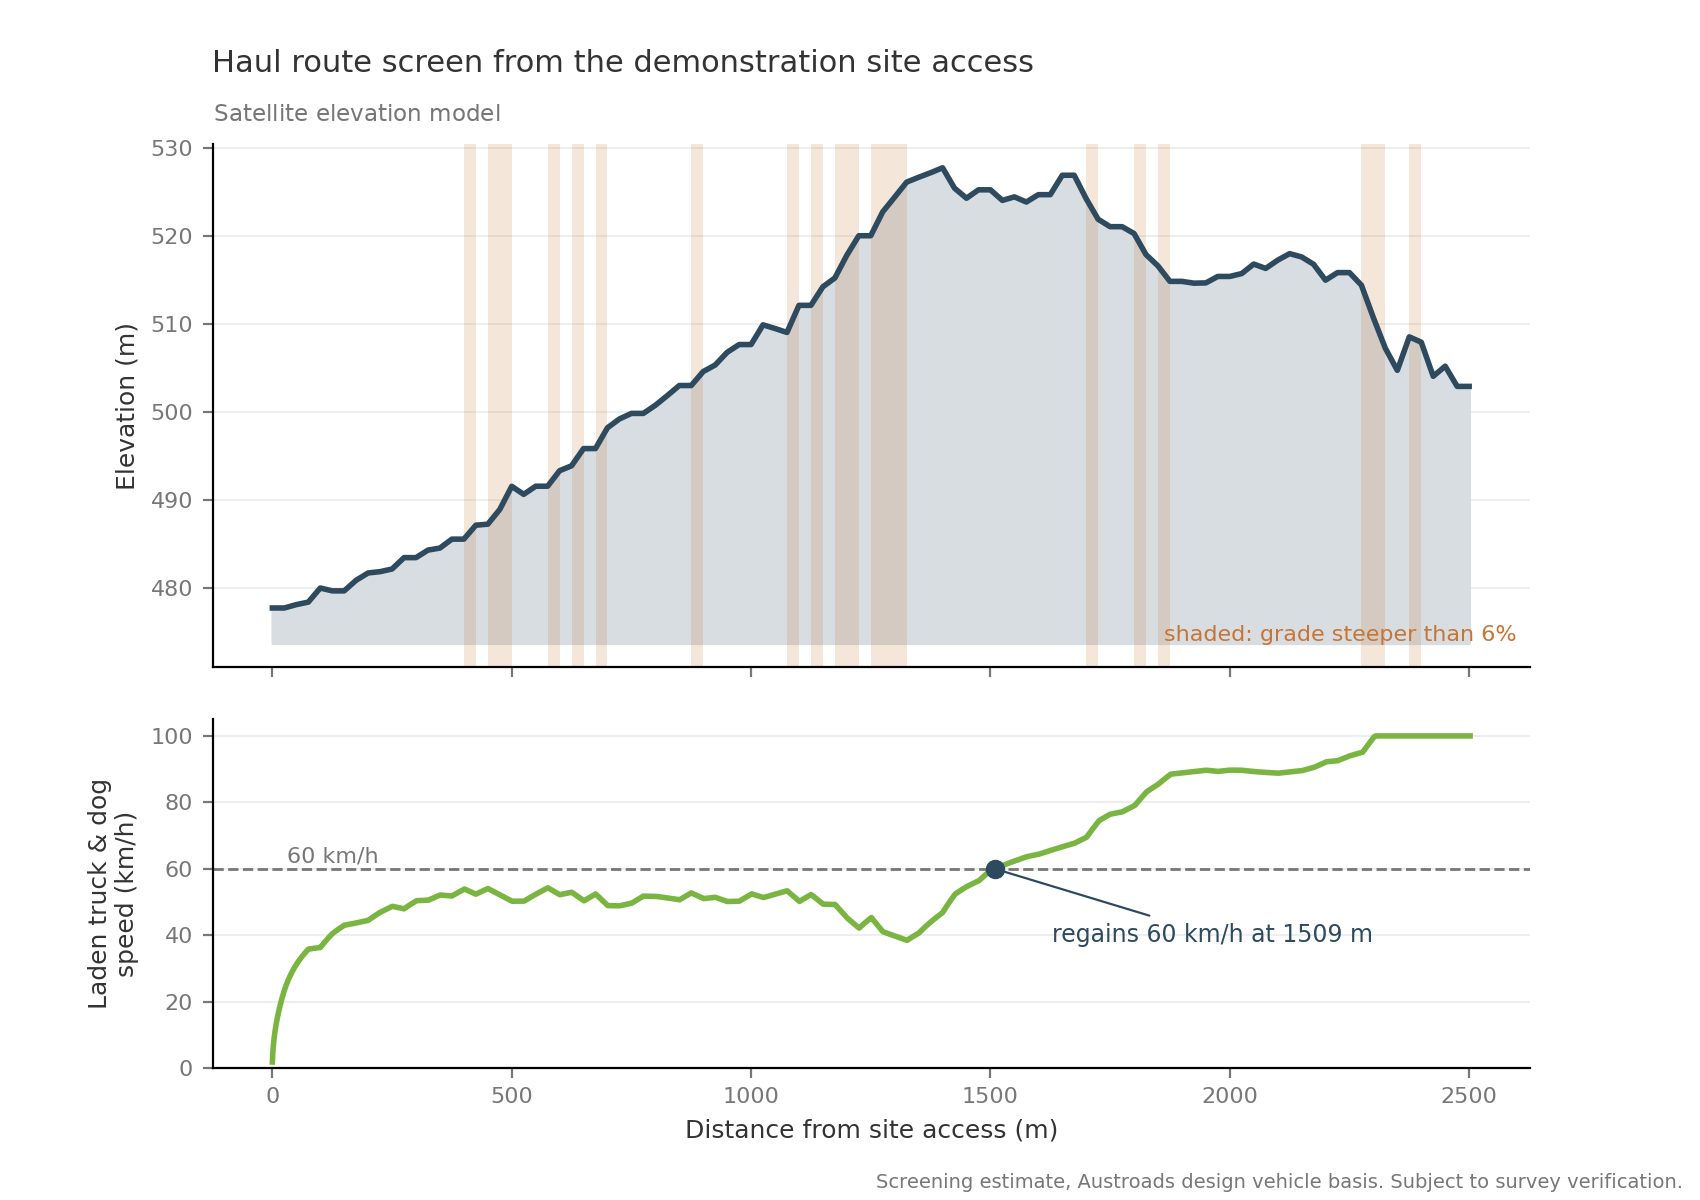
The profile above is the screen run on the demonstration site. Leaving the access, a laden truck and dog combination climbs about 50m of rise over the first 1.5km, drops to just under 40km/h where the grade is steepest, and does not regain 60km/h until roughly 1,500m from the access. Sections steeper than 6% are shaded. Where a road authority has placed a lane merge past a crest like that one, the numbers show whether entering trucks meet the accepted speed-differential test.
That is the level at which a road either supports a quarry or quietly kills it, and it is now part of the desktop screen. One chart reframes the traffic conversation for the site before a consultant is engaged.
The same road geometry and elevation data supports a first pass at the other access question: what can a driver actually see?
The screen locates terrain crests and horizontal curves along the road and compares them against the Safe Intersection Sight Distance (SISD) envelopes in the Austroads guides, roughly 180m of clear sight for an 80km/h road and around 260m for 100km/h. A crest or a tight curve inside that envelope is a flag. It does not fail the site. It tells you precisely where the traffic engineer needs to stand with a survey staff, and it does so while the site is still one candidate among 20.
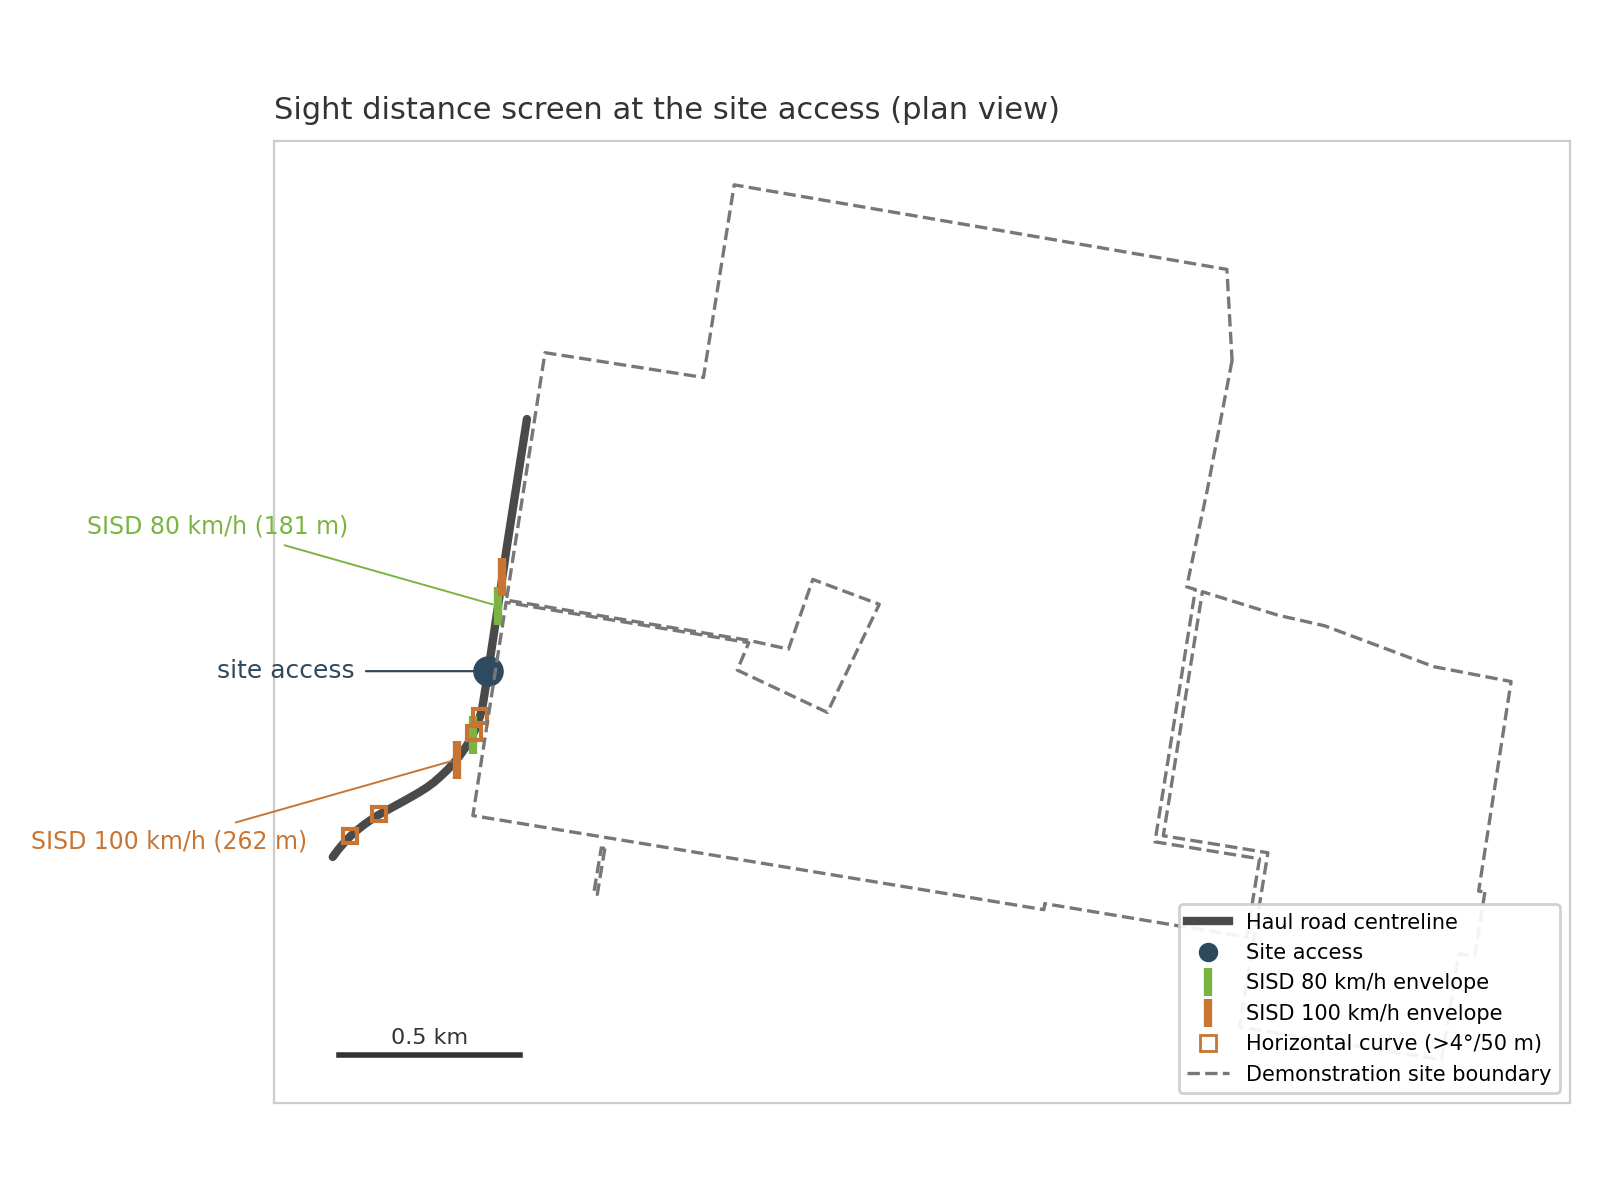
Roadside vegetation and cuttings sit outside what elevation data can see, so the screen states what it checked and routes the rest to survey. A desktop screen that is honest about its edges is worth more than one that pretends to be a determination.
Run this stack across a shortlist of 20 candidate sites and the conversation changes shape.
None of this replaces the geologist, the ecologist, the heritage consultant or the traffic engineer. It decides where they get sent, and it hands them a head start on the questions that matter. The screen also surfaces facts the specialists were not briefed to look for, which is what you want to find at the desktop stage and not at the hearing.
If you are screening a portfolio rather than a single site, the same stack runs across multiple holdings in one pass, and the same approach underpins our site reports for property developers.
Quarry site pre-screening is a desktop assessment that tests a candidate extractive industry site against government geology, environmental, heritage and road datasets before any consultant is engaged. It is used to rank a shortlist of candidate sites and to scope the specialist work the surviving sites will need.
Four groups. Mapped geology and mineral resource land determine whether the resource is there. Native vegetation categories, plant community types, threatened species records and water mapping determine the approval pathway and any biodiversity offset obligation. Aboriginal and historic heritage records plus dwelling proximity determine the receptor picture. Heavy vehicle access class, haul route gradient and sight distance determine whether the product can leave the site.
Because standard road datasets do not describe it. Centreline data records lane count and surface, but not gradient, climbing lanes or merge points. A route that looks acceptable on a map can hold a laden truck and dog below highway speed for kilometres of climb, which changes the traffic assessment and sometimes the viability of the site.
No. It is a preliminary screening tool built from government data. It decides where the specialists get sent and what they are briefed to look at. It is not a formal assessment, and it does not replace survey, drilling or accredited method work.
Yes. Constraint data is pre-computed for every cadastral lot in NSW, across all 128 local government areas.
Zoning maps say what is permissible. Geology maps say what is winnable. Neither says what is approvable.
Pre-screening candidate quarry sites across the resource, the environment, the receptors and the road, in one pass, is how you find the site where all four agree, before the capital is committed.
You can check any NSW property for free to preview its constraints, or see the report options and what each one covers.
MapCheck provides screening-level property information from government datasets. It is not legal, planning, environmental or financial advice, and figures are indicative value assessments subject to verification. Seek independent professional advice before acting. Maps in this article use a de-identified demonstration site; no proposal exists or is implied for that land.
Before you sign anything, do you know what you're actually buying? NSW rural properties carry layers of regulation that standard searches don't...
Ask anyone who has taken an extractive industry proposal through the NSW planning system and they will tell you the same thing: the rock is usually...
Most vendors think of due diligence as the buyer's job, something that happens after an offer is on the table. A growing number are flipping that...

3 min read
Buying rural property in NSW means inheriting a regulatory environment that doesn't always introduce itself politely. The Biodiversity Conservation...
3 min read
A rural land title in New South Wales sits under a stack of planning and environmental rules, each with its own jargon. Here is what the main terms...

3 min read
Client James T., Consultant and Hobby Farmer Location Northern Tablelands, NSW Turnaround 2 business days Product Property & Environmental Assessment (PEA)